Operational and financial metrics are aplenty in the apparel industry…, most of which are a result of financial analysis and review after a typical month-end. As a result, the impact of process measurements on problem-solving is not in real-time and hence not as much effective. According to Anand Deshpande, an organization can meet its operational goals by designing metrics that can be reviewed in a transparent manner either daily or hourly on the production floor. Anand is the Founder and CEO of Admaa Consulting.
Performance measures or KPIs (Key Performance Indicators) are an outcome of management’s need to manage performance. Some KPIs like output per day are the lagging indicators while some like cycle time are the leading indicators. A good factory scorecard consists of both lagging and leading indicators with a bias towards Operational Metrics. An example of leading indicators is cycle time, whereas an example of lagging indicator could be volume of goods produced daily. Success of the factory depends a lot on the quality and quantity of metrics that are measured and frequency of their review on the production floor. If the factory meets production targets on an hourly basis, it can meet monthly targets with ease.
Current scenario of performance measurement on apparel manufacturing shopfloor
Performance measurement on the shopfloor is typically limited to measuring output from some critical machines having sunrise and sunset meetings within teams and rounding off the day with priorities for the next day. Some factories do have a visual metric dashboard but metrics are usually not reviewed on an hourly basis. Hourly measurement of performance and its review on the production floor facilitate problem solving and play an important role in improving the flow through the constraint.
SQDCME Visual Dashboard
Shopfloor success is supplemented by creating visual dashboards that display the trend of important metrics over a period of time. These metrics are either measured daily or on an hourly basis and review of the same serves to institutionalize a problem-solving culture in the organization. Table 1 summarizes the dashboard metrics under various SQDCME elements of production management.
| Table 1: Dashboard metrics under various SQDCME elements of production management | |||
| Elements | Metric | Review Frequency | When |
| Safety | Accidents per day | Daily | Morning meeting |
| Near Miss | Daily | Morning meeting | |
| Quality | FTT% (First Time Through) | Daily | Morning meeting |
| Rejections | Every hour | Top of the hour | |
| Delivery | Jobs per hour | Every hour | Top of the hour |
| Volume per day | Daily | Morning meeting | |
| OEE% | Daily | Morning meeting | |
| WIP to SWIP ratio | Daily | Morning meeting | |
| Cost | Hours per unit | Weekly | Weekly meeting |
| Units per person | First Meeting | Morning meeting | |
| Morale | Absenteeism% | First Meeting | Morning meeting |
| Attrition% | Weekly | Morning meeting | |
| Environment | 5S audit score | Weekly | Morning meeting |
The review frequency of the metric depends on its impact on the floor performance. Review of jobs per hour on an hourly basis can help address constraints immediately and ensure smoother production flow in the ensuing hours. Lean measurements are lesser compared to financial performance measures in an organization. Therefore, only a few measures help an organization to focus on Lean manufacturing and meet overall operational goals.
Group leaders and supervisors collect floor measurements on an hourly and daily basis. The focus is on detecting abnormalities from standards and take immediate actions to rectify any issues that prevent meeting of standards. The data is represented visually at the end of the line or in the visual information centre, enabling transparency and problem-solving. Lean measurements help sustain Lean Culture in the organization. Sustenance of Lean Culture largely depends on Daily Accountability, Visual Management and Leader Standard Work.
Accidents Per Day
The accidents per day on the floor are depicted on the Safety Cross. The Safety Cross consists of 31 days of the month divided into the cross and marked with green if no accident has occurred and with red, if there is an accident.
The purpose of maintaining Safety Cross is to:
• Promote a mindset of safety in every employee.
• Promote the vision of making the workplace a safe one.
• Boost employee morale.
• Take countermeasures to ensure that accidents of that type do not recur.
Near Miss
Data analysis of accidents suggests that for every 300 no-injury incidents, there is one serious injury. Near Miss is a situation where an accident was avoided but probability of an accident was on. To avoid serious accident in the future, a Near Miss must be reported.
The purpose of reporting a Near Miss is to:
• Take countermeasures to avoid an accident in future.
• Encourage a safety mindset among employees.
• Boost employees’ morale.
First Time Through (FTT)
FTT expressed in terms of per cent is measured to check whether the products are manufactured right first time.
The purpose of tracking FTT is to:
• Determine the ability of the unit to manufacture right first time.
• Expose the hidden factory (scrap, rework, rejections).
• Measure the effectiveness of standardized work (non-varying cycle times).
• Focus on capability of the process.
Example: Assuming that an apparel is produced simplistically in sequential operations like Cutting, Sewing and Finishing, and the FTT for each of these departments is 90%, 90% and 90%.
The FTT% for the entire production line would be:
0.9 x 0.9 x 0.9 x 100
= 0.729 x 100 = 72.9%
It means that only 72.9% of the garments move through the production line without being reworked.
Rejection
The manufacturing team tracks rejection on an hourly basis and typically sums it up for the day.
The purpose of tracking rejections is to:
• Understand the hourly quality trend per hour.
• Discuss the root cause of rejections on an hourly basis.
• Trace the abnormality to the point of origin.
• Take countermeasures to address the same and prevent recurrence.
Jobs Per Hour
A manufacturing production floor typically tracks the output at the end of the line or end of department on an hourly basis. It is often referred to as ‘jobs per hour’ or simply as ‘hourly production’. (Table 2)
The purpose of tracking jobs per hour is to:
• Determine the ability of the department to meet the Takt Time.
• Provide timely/fast feedback on the bottlenecks and problems that should be fixed.
• Collate data to understand causes of failure and develop countermeasures to prevent recurrence.
• Resolve problems that prevent department from achieving the Takt Time.
Volume Per Day
A manufacturing production floor typically tracks the output at the end of the line or end of department at the end of the day. It is often referred to as daily volume or volume produced on that day.
| Table 2: A typical hourly jobs per hour report | ||||||
| Time | Plan | Actual | Plan Cum. | Actual Cum. | Variance (+/-) | Remarks |
| 8.00-9.00 | 60 | 55 | 60 | 55 | -5 | Bottlenecks in Machine A |
| 9.00-10.00 | 60 | 55 | 120 | 110 | -10 | |
| 10.00-11.00 | 60 | 40 | 180 | 150 | -30 | |
| 11.00-12.00 | 60 | 55 | 240 | 205 | -35 | High rejection this hour |
| 1.00-2.00 | 60 | 60 | 300 | 265 | -35 | |
| 2.00-3.00 | 60 | 65 | 360 | 330 | -30 | |
| 3.00-4.00 | 60 | 70 | 420 | 400 | -20 | |
| 4.00-5.00 | 60 | 55 | 480 | 455 | -25 | |
The purpose of volume per day is to:
• Determine the ability of the department to meet the daily volume.
• Provide feedback on capability of line or department to meet daily requirements.
• Collate data to understand causes of failure and develop countermeasures to prevent recurrence.
• Resolve problems that prevent department from meeting daily volume target.
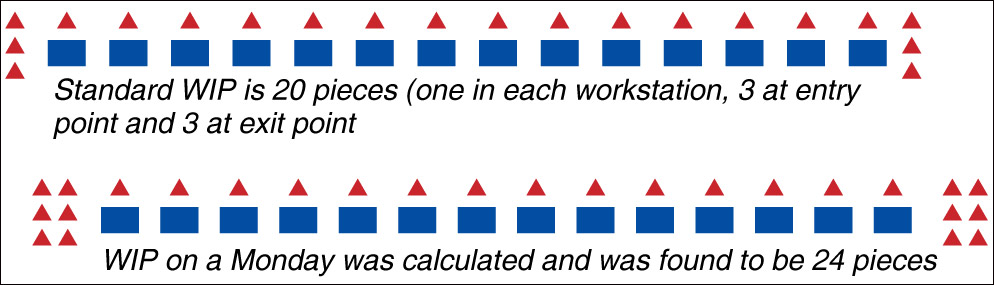
WIP to SWIP Report
WIP to SWIP Report shows the inventory of the product in the cells. SWIP is Standard Work in Progress and WIP is Work in Progress.
The purpose of tracking WIP to SWIP report is to:
Determine the inventory balance on the production line.
• Measure the effectiveness of the pull system.
• Support workplace organization.
• The WIP to 3SWIP ratio is (24/20) = 1.2
If the ratio is greater than one, there is more inventory and therefore overproduction. If the ratio is less than one, then there could be starving in the system and therefore underproduction. It is also possible that the Cycle Time is more than the Takt Time.
Overall Equipment Effectiveness (OEE%)
OEE% tracks the ability of machines in the cell to produce the product in the right time and with the right quality.
The purpose of tracking OEE% is to:
• Support total productive maintenance.
• Reduce machine down time.
• Improve settings on the machine.
• Improve process capability.
The machine data for overlock machine is as follows:
Net Operating Time: 400 minutes
Running Time: 300 minutes (deduct breakdowns and setup time)
Actual Output: 500 parts
Target Output: 700 parts (losses due to minor stoppages and reduced speed of working)
Good Output: 450 parts
Actual Output: 500 parts
OEE% = (Availability x Performance x Quality) x 100%
Availability = (Total Available Time – Breakdown Time)/(Total Available Time) = (400-100)/400 = 300/400 = 0.75
Performance = Actual Output/Target Output = 500/700 = 0.71
Quality = Good Output/Actual Output = 450/500 = 0.9
OEE% = 0.75 x 0.71 x 0.9 = 47. 92%
The OEE% must be as high as possible. While there is no benchmark, anything above 80-85% is considered to be good.
Units Per Person
Units per person measures the numbers of units produced by one person.
The purpose of tracking units per person is to:
• Ensure that productivity of the value stream increases steadily over the time.
• Use data to set performance improvement targets.
If a jacket sewing line produces 500 jackets with 120 people, the units per person or productivity per person is 500/120, i.e. 4.16 jackets per person.
Hours Per Units
Hours per unit measures the number of labour hours required to produce one unit.
The purpose of tracking hours per unit is to:
• Ensure that the productivity of the value stream increases steadily over time.
• Use data to set performance improvement targets.
• Consider overtime hours to get correct estimate of labour used to produce the given output.
If a jacket sewing line produces 500 jackets with 120 people (8 hours per person) and overtime hours amount to 50 hours, then the hours per unit = (12×8) + 50/500 = 2.2 hours per unit.
5S Audit Score
Workplace organization is paramount to creating a world-class factory. Often it is the most ignored element of Production Management. Usually a Scoring checklist is used to note the score against each line item on 5S.
A very good score is above 80 out of 100. We could keep the frequency of 5S score calculation for one week.
The purpose of computing 5S score is to:
• Promote cleanliness in the plant.
• Create a safe and productive workplace.
• Reduce searching time.
• Boost employees’ morale.
Daily accountability, Visual Management and Leader Standard Work lead to sustaining a lean culture that focuses on problem-solving.
One tool that reinforces daily accountability is ‘meetings’ – morning meetings and hourly meetings.
Recommended Agenda for Morning Meetings
The Supervisor, after the manning of the production line, should conduct a morning meeting. He should ask the following in this sequence:
How well did we do yesterday?
Today’s targets and plan:
• Any safety accidents or near misses yesterday?
• Are we staffed adequately?
• How do we address quality issues?
• Any bottlenecks we faced for volume delivery yesterday?
• How was the productivity?
• Any absenteeism today or yesterday?
• Any planned changes today like layout, etc.?
• Do we have any concerns?
• Who will do what and when?
Expected output from the morning meeting:
The meeting must not be longer than 10-15 minutes.
• Clear plan for the day.
• Who will do what and when?
Advantages of team morning meetings:
• Reduce communication time.
• Ensure team alignment on KPI’s.
• Encourages team work.
• Improve team problem solving.
• Impact KPI’s positively.
Recommended agenda for Hourly Meetings:
• The supervisor or the team leader will hold this meeting every production hour. He should ask the following questions:
• How well did we do in the last hour?
• Did we face any quality issues?
• What is the root cause of the issues?
• Who will ensure that problem is fixed in the next hour?
• Did we face any output issues?
• How do we overcome the bottleneck if any?
• Who will do what and when in the next hour?
Expected output from the morning meeting:
The meeting must not be longer than 5-10 minutes.
• Clear Plan for the next hour
• Who will do what and when?