Employee productivity is a combination of correct methods, well set-up machinery for efficient workflow, quality assurance systems in place, available materials and employee motivation. If all of these are in place, the outcome will be a correct specification garment, within the time that the company has costed for, to be delivered when the customer wants it. The role of management is to make sure these five cornerstones are in place.
There are three levels of workflow to consider within a factory for improving productivity: flow of work to and from an operator, which links to methods and line layout discussed in the article (SW August 2010); flow of work through the factory from receipt of material to dispatch of product, which has been reviewed in this issue. This follows on from Value Stream Mapping mentioned in the earlier article (SW July 2010). Lastly, flow of work to and from the factory that relates to suppliers and customers.
The faster the workflow in, through and out of one’s company, the more productive one is and the more money one will make. Therefore, it makes sense to organize the physical layout of one’s factory to minimize the time for garment production, says Paul F. Bowes.
Case Study – Linea Intimates Fashion India (LIFI)
LIFI was a fairly typical ladies underwear manufacturer that focused mainly on ‘Brief’ production, and was setup in a small building. The factory was spread over the two floors, with the material warehouse and cutting room on the second floor, and the sewing units spread out in several rooms on the third floor along with the finished goods warehouse.
This meant the fabric was transported to the receipt of material (RM) store, then cut, and the cut pieces were moved to the various sewing sections. The transportation of work was difficult, and the control of WIP could easily be lost. Additionally there was a need to increase sewing capacity.
Improved Layout
The management team carried out a number of kaizen events and did a material flow diagram of how material and work was being transported through the process. The diagram showed that fabric was being brought up two storeys, being stored in a warehouse about 150 m from the central cutting room; cut work was then kept in the cut work store and moved to one of two sewing rooms, where the Briefs were made and packed before being moved to the finished goods store.
diagram 1: Linea Intimate Fashion, India Original Layout – second floor

The whole process took 36 days from receipt of fabric for a product that has a total manufacturing time of around 5 minutes.
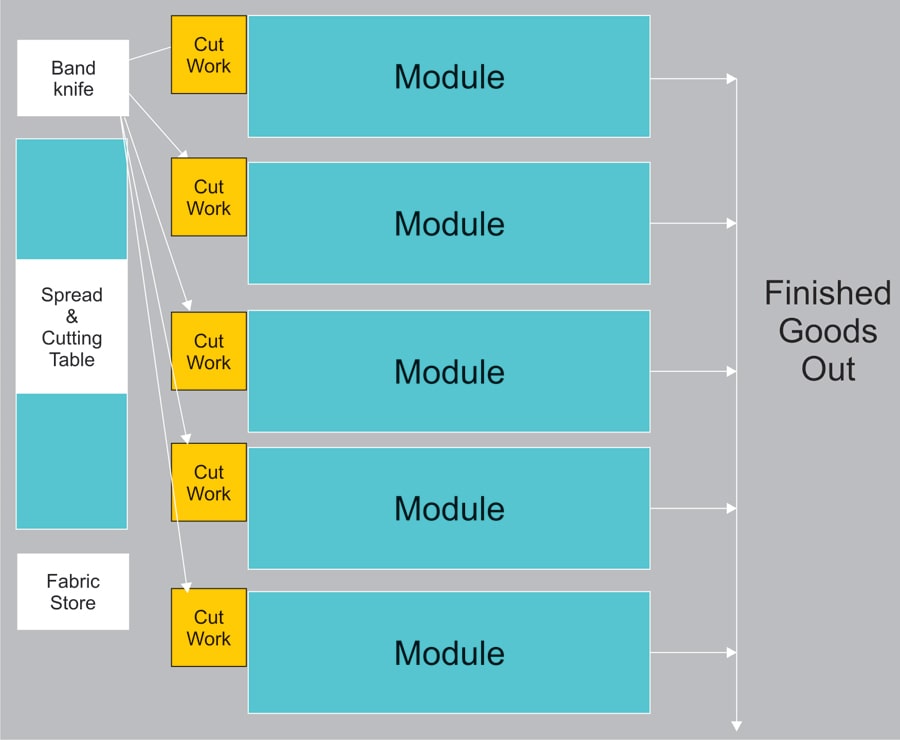
The solution was to change the factory layout by breaking down the central cutting room and placing spreading/cutting tables alongside the sewing teams that were making the product. A balancing calculation was completed to make sure that one table could effectively provide product for 5 sewing teams.
With the new layout as shown, the process time was reduced to 20 days for completion of an order and actual throughput time was also reduced to less than 3 days from fabric issue to boxed stock.
The change of factory layout meant that fabric was still brought into the same RM Store, but could be issued straight to the point of production. The layout within each sewing area shows the cutting/spreading tables supplying up to 5 sewing teams.
Case Study – MAS Intimates Thurulie (Sri Lanka)
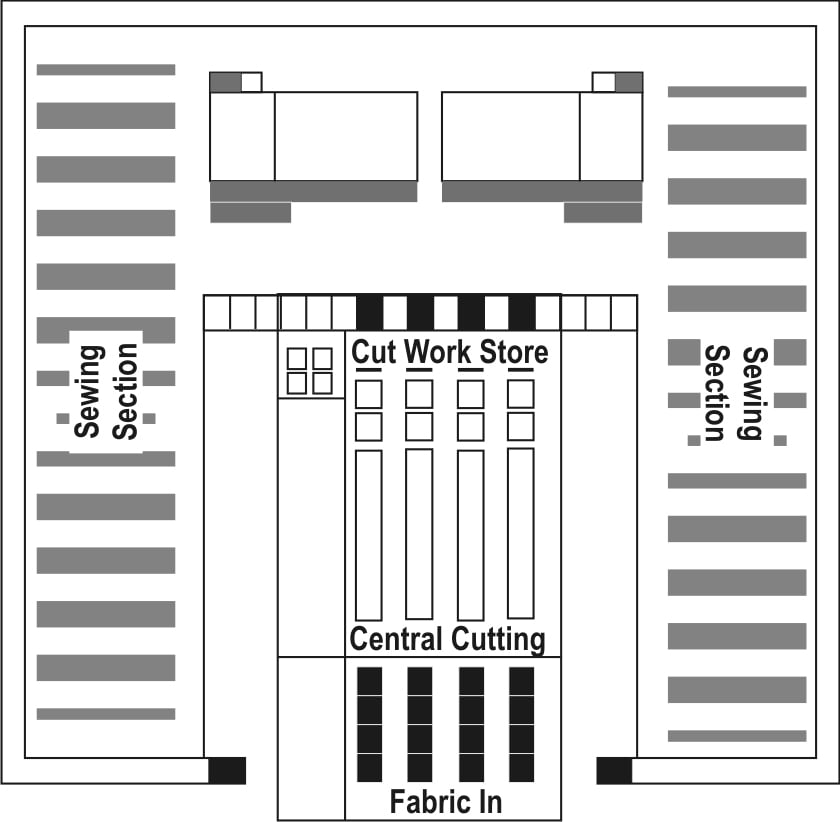
The MAS Intimates factory at Thulhiya was a unique opportunity to design a factory layout for fast throughput of work (Diagram 3). The management team took the opportunity to visit a number of other factories to pick up best practice ideas, and then develop a layout from there to suit the product type – ladies bras and briefs.
The original building design was for a large central store and cutting/molding area with two-storey sewing team buildings on either side.
The fabric was to be delivered to the front of the building into a fabric store. From there the fabric would be issued out to the central cutting section and cut work stored before issue to one of the four sewing units (two wings on two floors).
The physical layout of the factory was already well underway when the management team realized that to be truly lean, reduce transportation and WIP and have a visual control of production; the central cutting room idea would have to be replaced by placing spreading and cutting tables with the sewing teams.
Improvements undertaken
The layout as in Diagram 4 was adopted in each of the sewing units, with the spreading/cutting table being placed in the centre of 10 sewing teams. The balance between cutting output and sewing was calculated to ensure that sewing could be supported by one table. It was calculated that, using one spreader, it would be easy to cut enough product to support requirement.
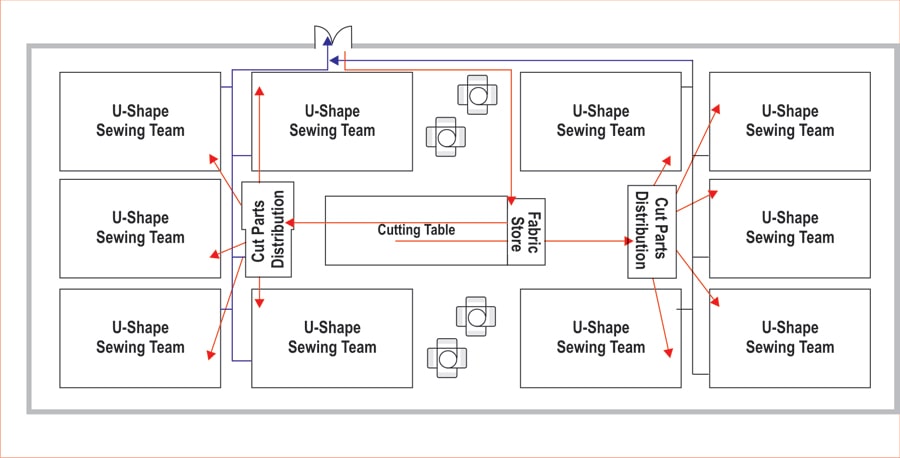
The fabric was delivered through the door entrance to the store area at the end of the spreading/cutting table. The cut work was placed into a store area at either end of the table, clearly marked for a particular sewing team. The U-shaped teams produced the garments and packed at the end of the team.
A final AQL check was made before sealing the packed work, and, once approved, the box was sealed and picked up on a regular two-hourly run.
The result was a throughput time of less than 2 days from fabric being received into the room to packed boxes being sent out.
In the centre building, the store area for fabric and finished goods was extended, with a later plan to outsource all warehousing to a local warehouse/logistics company. The layout was planned (Diagram 5) to maximize space utilization while minimizing material and work movement.
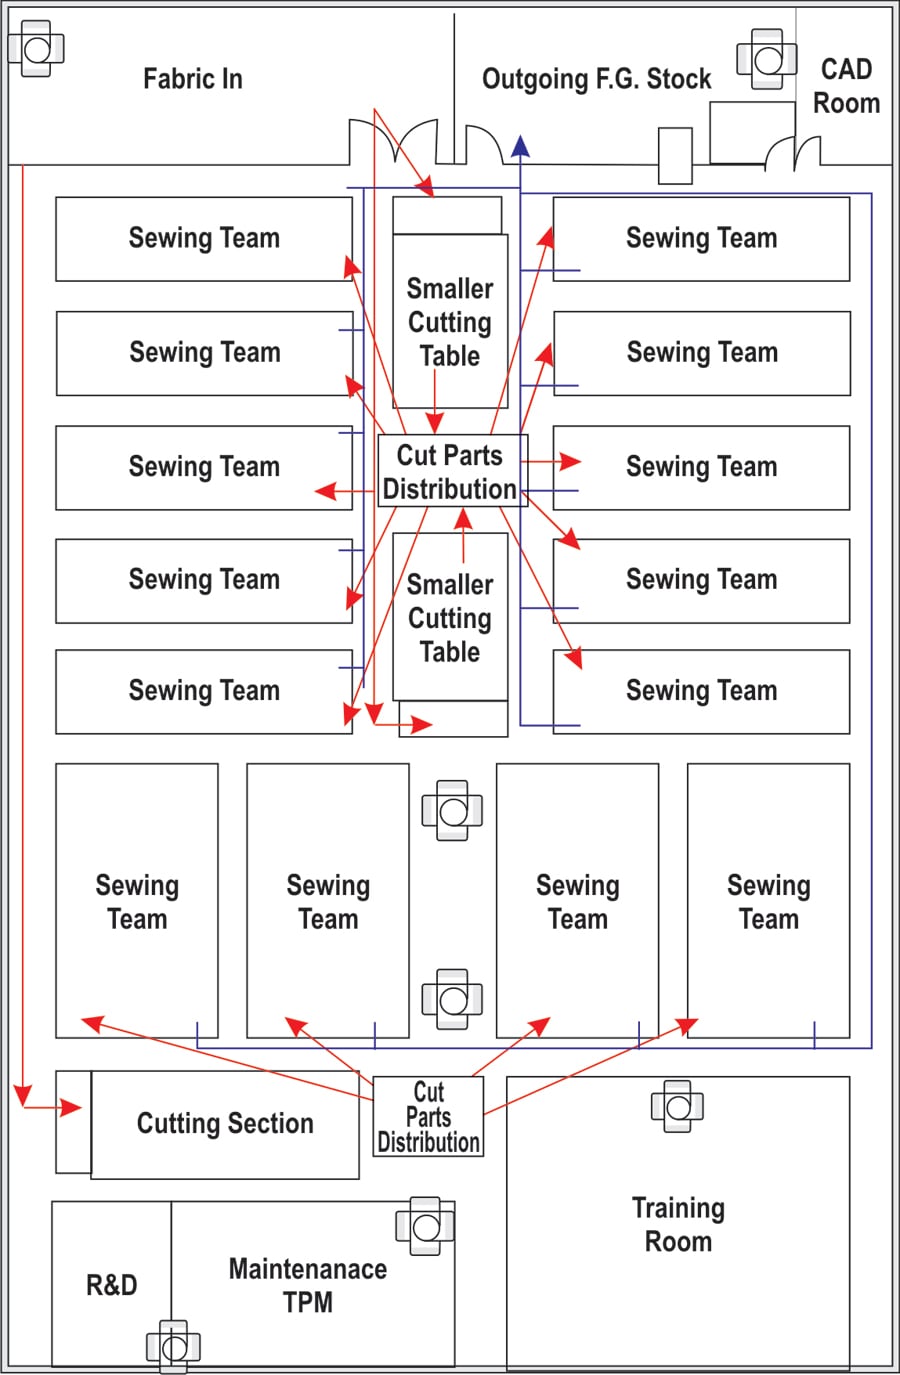
Smaller cutting tables were positioned in the centre of the building feeding work to either 4 or 5 teams. The training school was also incorporated into the building, as was an R&D/TPM/quick changeover area, which the mechanic team used to set up machines ready for new products, as well as develop attachments, and carry out routine maintenance.
Measuring Performance
Ideally, companies should measure improvement based on cash in cash out for a purchase order (PO) and see if the time is reducing. If it is, then the company is improving. In factory units there are a few key performance measures to focus on.
PO Throughput time – Measure how long it takes from the receipt of fabric for a purchase order to dispatch of the full order This will tell if you are reducing time through eliminating non-value activities.
Quality – Right First Time (RFT) is a multiplication of the pass rate at each stage. The key is to take action as soon as a quality problem is found. The Cost of Quality (COQ) is a useful tool in focusing management on the losses incurred by doing things wrong.
Delivery on Time – Measure the quantity shipped against customer required quantity on time to the customer required date.
Output/operator hours – This will give a measure of productivity; also efficiency can be calculated by standard hours produced/operator hours.
Cut to Ship percentage – This is an excellent measure for material utilization. It is the number of garments shipped divided by the number cut. It also gives an idea of quality levels.
Employee Motivation – Absenteeism levels; labour turnover; number of days without an accident.
Summary
Lean and agile systems are all about reducing the time it takes between receiving an order and getting paid. The above techniques for improving factory productivity through relayout are aimed at improving one or more of the measures indicated, and keeping value adding employees working by providing the materials they need.
The key factor at all times is to keep material moving through value adding operations that transform the product and minimize the distance a garment has to travel between fabric receipt and carton finished goods stock.